Overview
In this lab, you will learn about the agile planning and portfolio management tools and processes provided by Azure DevOps Server 2019 and how they can help you quickly plan, manage, and track work across your entire team. You will explore the product backlog, sprint backlog, and task boards which can be used to track the flow of work during the course of an iteration. We will also take a look at how the tools have been enhanced in this release to scale for larger teams and organizations.
Prerequisites
In order to complete this lab you will need the Azure DevOps Server 2019 virtual machine provided by Microsoft. Click the button below to launch the virtual machine on the Microsoft Hands-on-Labs portal.
Alternatively, you can download the virtual machine from here.
Exercise 1: Agile Project Management
Task 1: Working with teams, areas, and iterations
-
Log in as Sachin Raj (VSALM\Sachin). All user passwords are P2ssw0rd.
-
Launch Internet Explorer from the taskbar.
-
Click the PU DevOps Portal shortcut to navigate to the PartsUnlimited DevOps portal.
-
Open the settings page using the Project settings navigation located at the bottom left of the page.
-
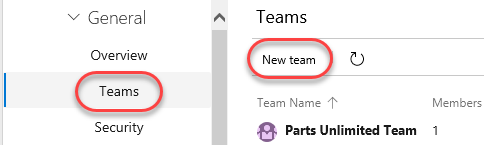
Select Teams under General. There are already a few teams in this project, but you’ll make a new one for this lab. Click New team.
-
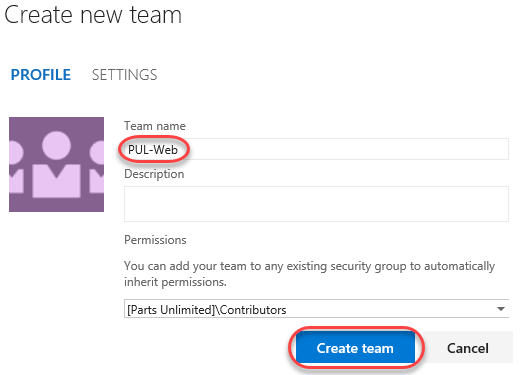
Use “PUL-Web” as the Team name and click Create team.
-
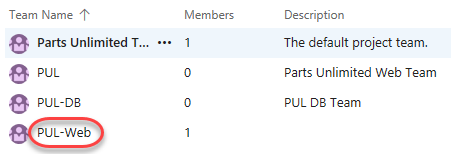
Select the newly created team to view its details.
-
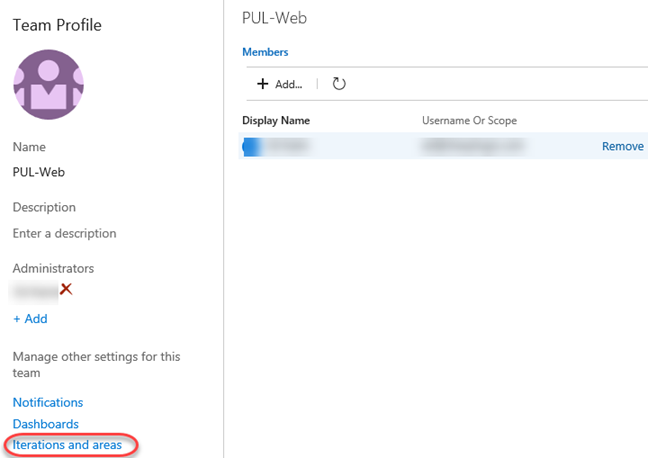
By default, the new team has only Sachin as its member. You can use this view to manage membership, notifications, dashboards, and more. But first you will want to define the schedule and scope of the team. Click Iterations and areas.
-
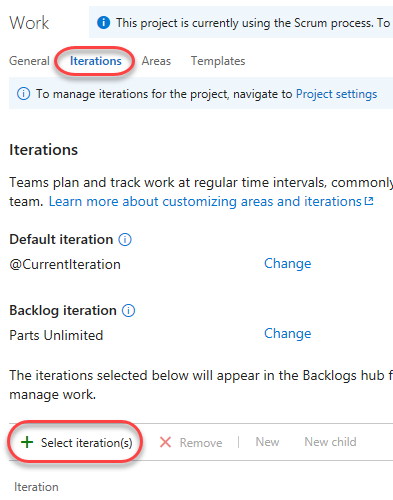
Select the Iterations tab and click Select iterations. This team will use the same iteration schedule that’s already in place for the other teams, although you can take a different route if that’s better for your organization.
-
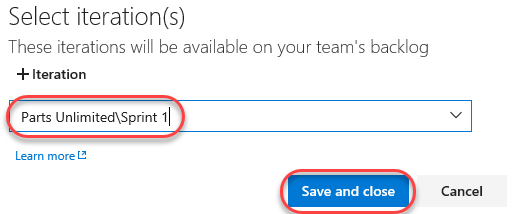
Select Parts Unlimited\Sprint 1 and click Save and close. Note that this first sprint has already passed. This is because the demo data generator is designed to build out project history so that this sprint occurs in the past.
-
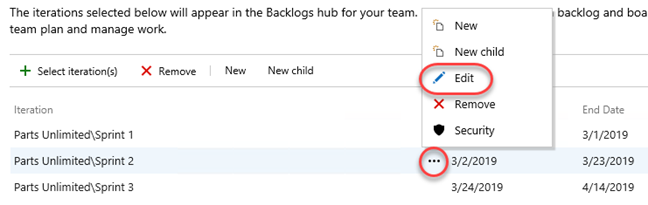
Repeat the process to add Sprint 2 and Sprint 3. This lab requires the second sprint to be our current iteration, so edit the end date to reflect a day after today. Also adjust the Sprint 3 dates to occur after Sprint 2.
-
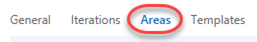
Select the Areas tab. By default, there is an area matching the name of the team.
-
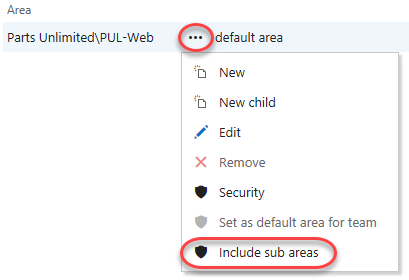
From the area dropdown, select Include sub areas. The default setting for all teams is to exclude sub-area paths. We will change it to include sub-areas so that the team gets visibility into all of the work items from all teams. Optionally, the management team could also choose to not include sub-areas, thereby removing work items from their view as soon as they are assigned to one of the teams.
Task 2: Working with work items
-
Work items play a prominent role in Azure DevOps. Whether describing work to be done, impediments to release, test definitions, or other key items, work items are the workhorse of modern projects. In this task you’ll focus on using various work items to set up the plan to extend the Parts Unlimited site with a product training section. While it can be daunting to build out such a substantial part of a company’s offering, Azure DevOps and the Scrum process make it very manageable.
-
This task is designed to illustrate a variety of ways you can create different kinds of work items, as well as to demonstrate the breadth of features available on the platform. As a result, these steps should not be viewed as prescriptive guidance for project management. The features are intended to be flexible enough to fit your process needs, so explore and experiment as you go.
-
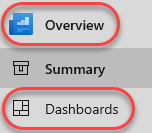
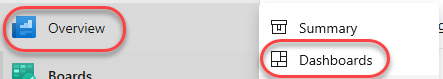
Navigate to Overview | Dashboards.
-
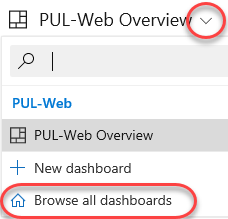
From the dropdown, select Browse all dashboards.
-
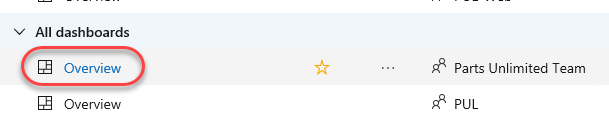
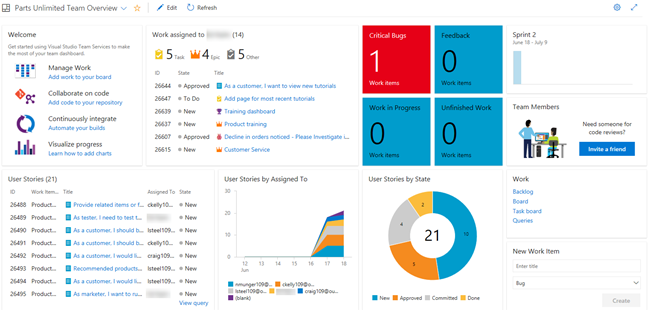
Select the Overview dashboard for Parts Unlimited Team.
-
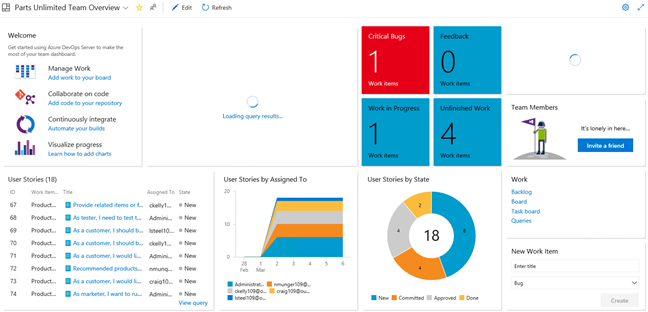
Dashboards provide great flexibility and insight for your team. This dashboard provides an intuitive way for anyone on the team to understand the state of the project at a glance.
-
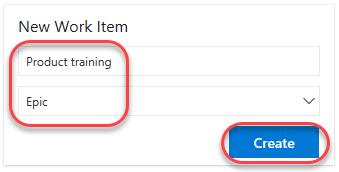
There are many ways to create work items in Azure DevOps, and we’ll explore a few of them. Sometimes it’s as simple as firing one off from a dashboard. In the New Work Item form, type “Product training” and select the Epic type. Click Create.
-
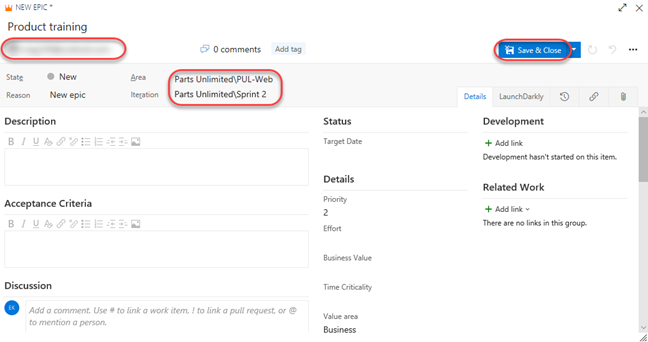
Assign the new work item to Sachin and set the Area to Parts Unlimited\PUL-Web. Set the Iteration to Parts Unlimited\Sprint 2 and click Save & Close. Ordinarily you would want to fill out as much information as possible, but you can run lean here for the purposes of this lab.
-
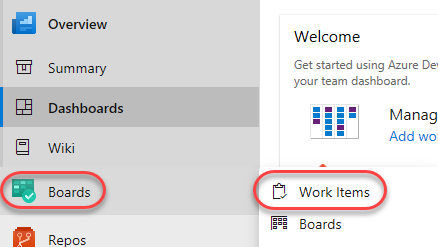
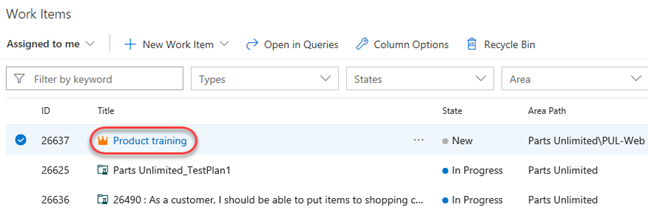
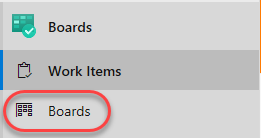
Navigate to Boards | Work Items.
-
Locate the newly created epic for Product training and open it.
-
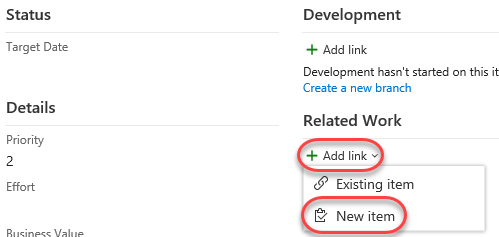
The work item form includes everything you could ever want to know about a work item. This includes details about who it’s assigned to, its status across many parameters, and all the associated information and history for how it has been handled since creation. One of the key areas to focus on is the Related Work. One of the ways to add a feature to this epic is to select Add link | New item.
-
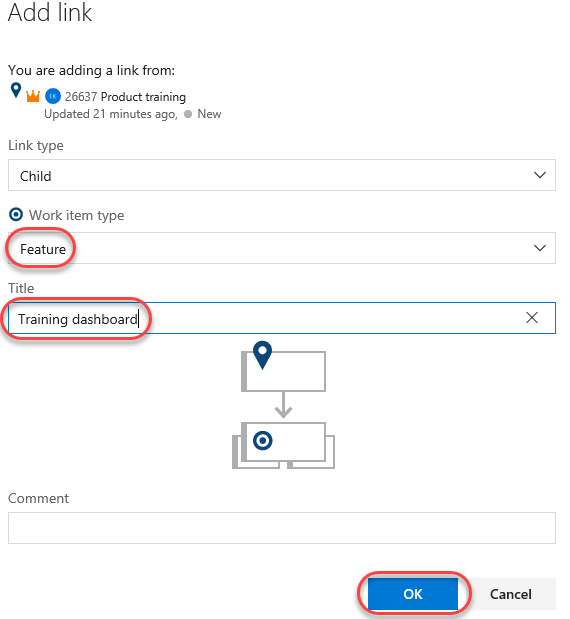
Set the Work item type to Feature and set the Title to “Training dashboard”. Click OK.
-
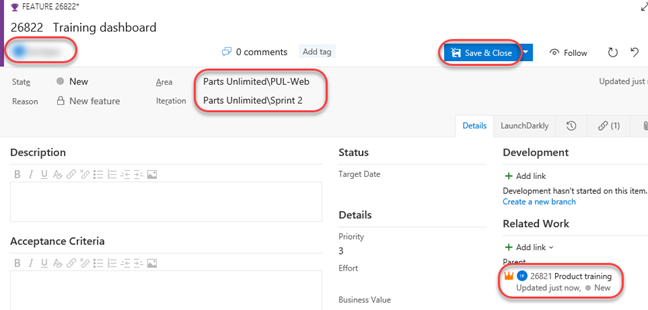
The new feature’s Assignment, Area, and Iteration should already be set to the same as the epic it was created from. They should also be linked. Click Save & Close.
-
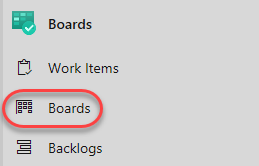
Navigate to the Boards view.
-
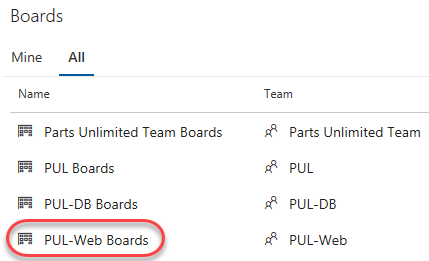
Select PUL-Web Boards. This will open the board for that particular team.
-
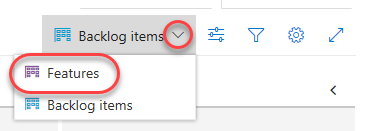
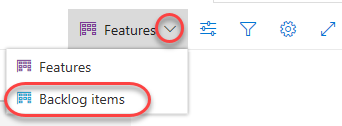
Switch the board from showing Backlog items to showing Features. This will make it easy to add tasks and other work items to the features.
-
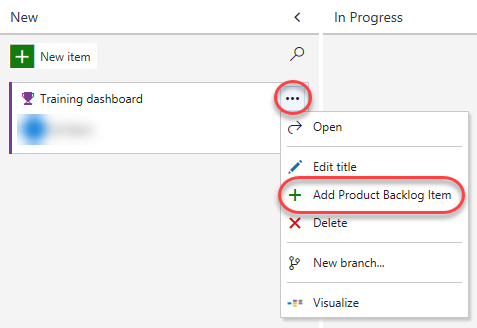
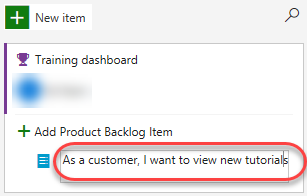
From the Training dashboard dropdown, select Add Product Backlog Item.
-
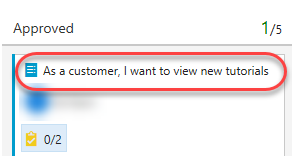
Name the first backlog item “As a customer, I want to view new tutorials” and press Enter to save. This creates a new Product Backlog Item (PBI) work item that is a child of the feature and shares its area and iteration.
-
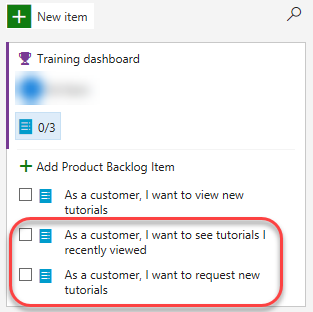
Add two more PBIs designed to enable the customer to see their recently viewed tutorials and to request new tutorials.
-
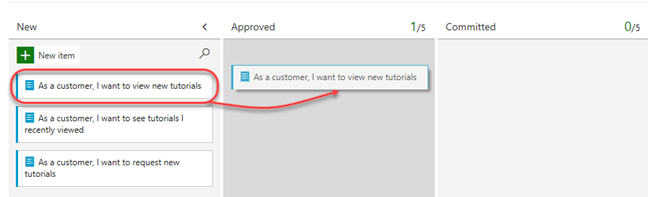
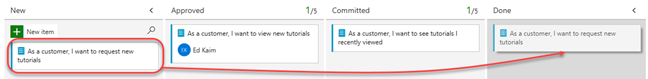
Switch the task board view back to Backlog items.
-
Backlog items have a state that defines where they are relative to being completed. While you could open and edit the work item using the form, it’s easier to just drag cards on the board. Drag the first work item to Approved.
-
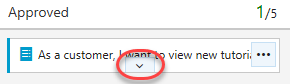
You can also expand work item cards to get to conveniently editable details.
-
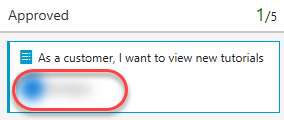
Assign the moved PBI to Sachin.
-
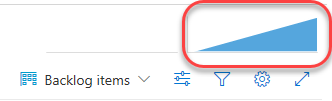
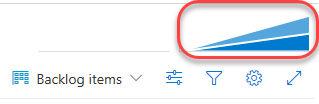
Note that the Cumulative flow diagram has updated to reflect the change in work for the team.
-
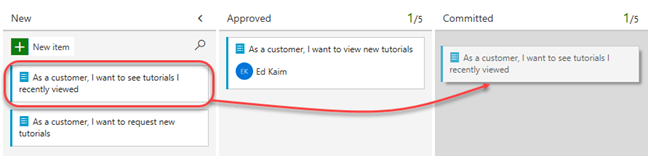
Drag the second work item to the Committed stage.
-
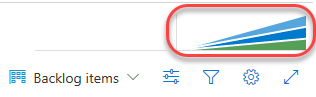
The CFD will update again to reflect this change in status.
-
Drag the final PBI to the Done stage.
-
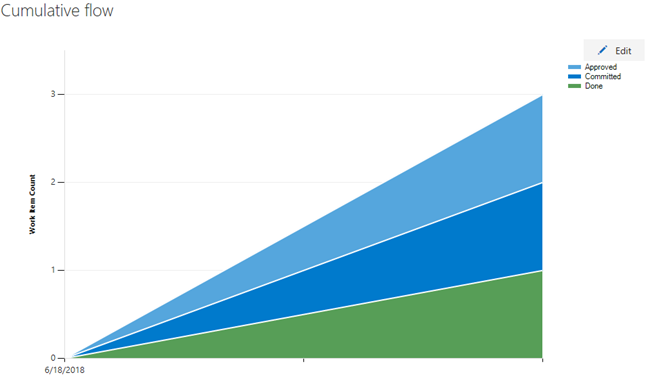
Click the CFD to open it.
-
There are now three work items in different stages for this team.
-
The task board is one view into the backlog. View the tabular form by clicking View as backlog.
-
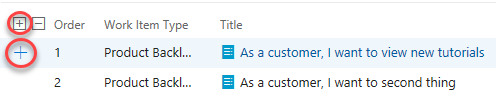
Click the Expand button, which allows you to view nested tasks under these work items. Another easy way to create work items is using the Add button on the backlog. Click it to add a new task to the first backlog item.
-
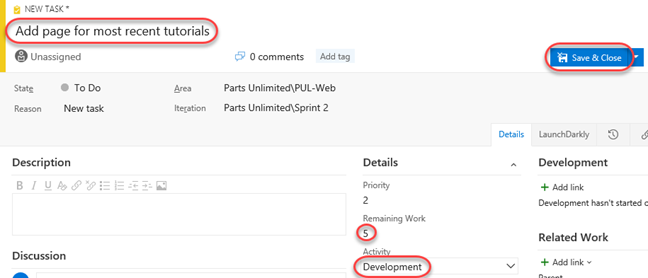
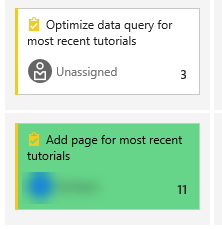
Set the Title to “Add page for most recent tutorials”. Set the Remaining Work to “5”and the Activity to “Development”. Click Save & Close.
-
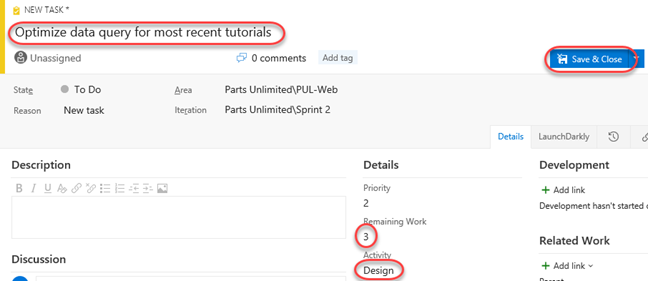
Add another task to “Optimize data query for most recent tutorials”. Set its Remaining Work to “3” and its Activity to “Design”. Click Save & Close.
Task 3: Managing sprints and capacity
Your team builds the sprint backlog during the sprint planning meeting, typically held on the first day of the sprint. Each sprint corresponds to a time-boxed interval which supports your team’s ability to work using Agile processes and tools. During the planning meeting, your product owner works with your team to identify those stories or backlog items to complete in the sprint.
Planning meetings typically consist of two parts. In the first part, the team and product owner identify the backlog items that the team feels it can commit to completing in the sprint, based on experience with previous sprints. These items get added to the sprint backlog. In the second part, your team determines how it will develop and test each item. They then define and estimate the tasks required to complete each item. Finally, your team commits to implementing some or all the items based on these estimates.
-
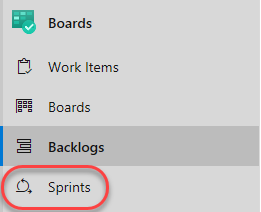
Your sprint backlog should contain all the information your team needs to successfully plan and complete work within the time allotted without having to rush at the end. Before you start planning your sprint, you’ll want to have created, prioritized, and estimated your backlog and defined your sprints. Navigate to the Boards | Sprints view using the navigation.
-
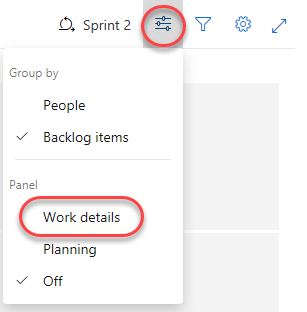
From the View options dropdown, select the Work details panel option.
-
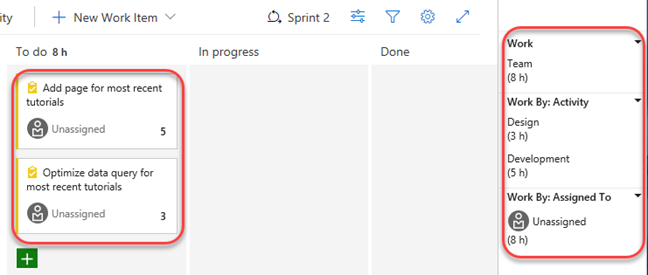
The current sprint has a pretty limited scope. There are two tasks in the To do stage that combine for 8 hours of estimated work. At this point, neither task has been assigned.
-
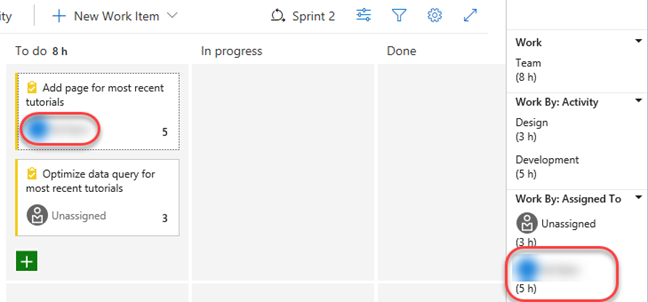
Assign the Add page task to Sachin. Note that this updates the capacity view.
-
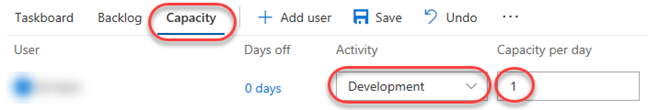
Select the Capacity tab. This view enables you to define what activities a user can take on and at what level of capacity. In this case, set Sachin’s capacity to allow “1” hour of Development per day. Note that you can add additional activities per user in the case they do more than just development.
-
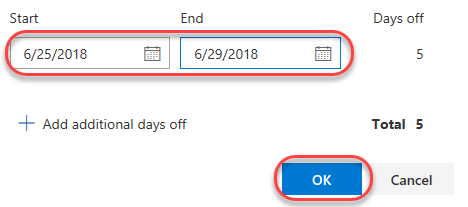
However, let’s assume Sachin is going to take some vacation. Click 0 days under Days off.

-
Set your vacation to span five work days during the current sprint (within the next few weeks). Click OK.
-
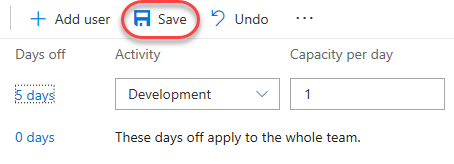
Click Save.
-
Return to the Taskboard.
-
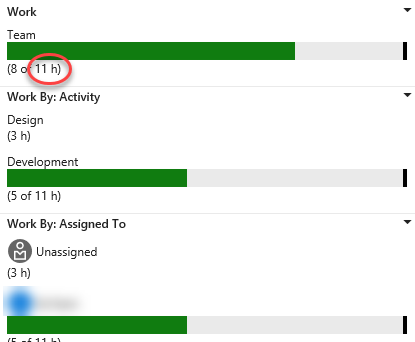
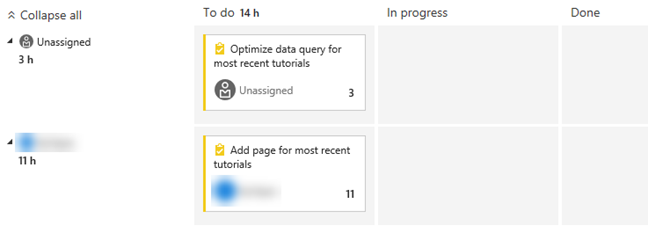
Note that the capacity view has been updated to reflect your available bandwidth. This exact number may vary, but for the screenshots here, that sprint capacity is 11 hours (1 hour per day over 11 working days).
-
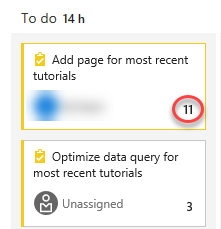
One convenient feature of the boards is that you can easily update key data in-line. It’s a good practice to regularly update the Remaining Work estimate to reflect the amount of time expected for each task. Let’s say you’ve reviewed the work for the Add page task and found that it will actually take longer than originally expected. Set it to whatever your total capacity is for this sprint.
-
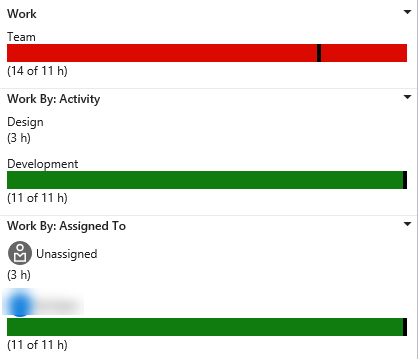
Note how this expands the Development and your personal capacities to their maximum. Since they’re large enough to cover the assigned tasks, they stay green. However, the overall Team capacity is exceeded due to the additional 3 hours required by the other task.
-
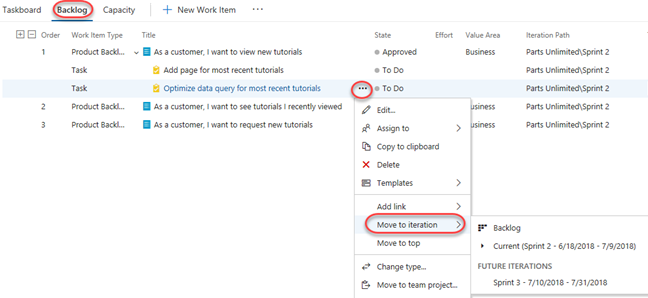
One way to resolve this capacity issue would be to move the task to a future iteration. There are a few ways this could be done. First, you could open the task here and edit it in the dialog. The Backlog view, on the other hand, provides an in-line menu option to move it. Don’t move it now.
-
Return to the Taskboard view.
-
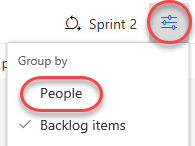
Select People from the View options dropdown.
-
This adjusts your view such that you can review the progress of tasks by person instead of by backlog item.
-
There is also a lot of customization available. Click the Configure team settings button.
-
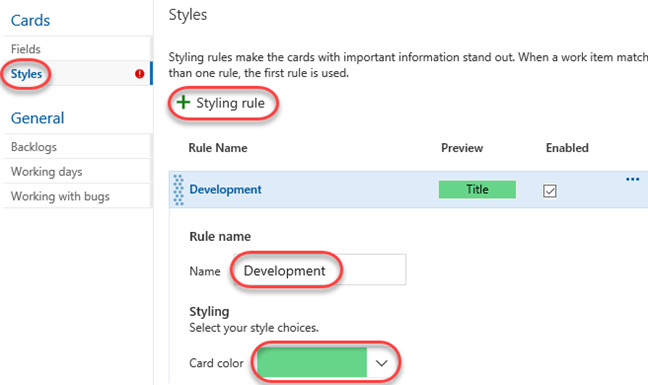
On the Styles tab, click Add Styling rule and set the Name to “Development”. Choose a green Card color. This will color all cards green if they meet the rule criteria set below.
-
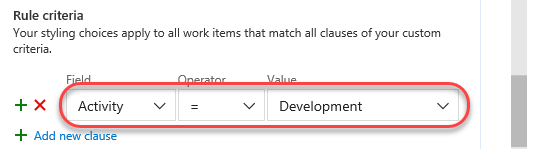
Add a rule for Activity = Development. This will set all cards assigned to Development activities green.
-
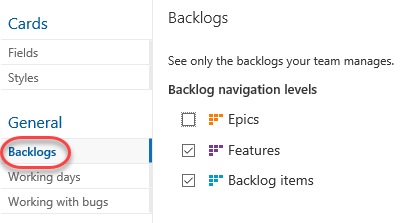
The Backlogs tab allows you to set the levels available for navigation. Epics are not included by default, but you could change that here.
-
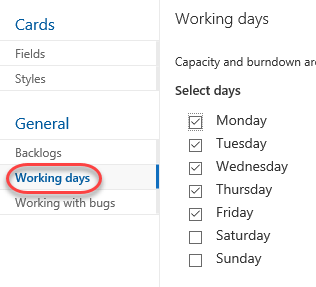
You can also specify the Working days the team follows. This applies to capacity and burndown calculations.
-
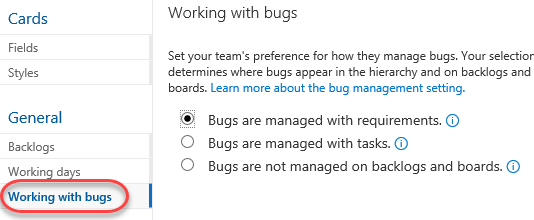
The Working with bugs tab allows you to specify how bugs are presented on the board.
-
Click Save to save the styling rule.
-
The task associated with Development is now green and very easy to identify.
Task 4: Customizing Kanban boards
To maximize a team’s ability to consistently deliver high quality software, Kanban emphasize two main practices. The first, visualize the flow of work, requires you to map your team’s workflow stages and configure your Kanban board to match. The second, constrain the amount of work in progress, requires you to set work-in-progress (WIP) limits. You’re then ready to track progress on your Kanban board and monitor key metrics to reduce lead or cycle time. Your Kanban board turns your backlog into an interactive signboard, providing a visual flow of work. As work progresses from idea to completion, you update the items on the board. Each column represents a work stage, and each card represents a user story (blue cards) or a bug (red cards) at that stage of work. However, every team develops its own process over time, so the ability to customize the Kanban board to match the way your team works is crucial.
-
Navigate to Boards.
-
Click the Configure team settings button.

-
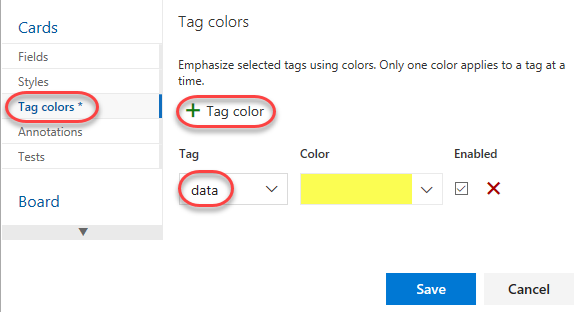
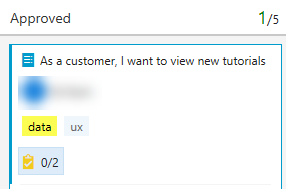
The team is emphasizing work done with data, so there is special attention paid to any task associated with accessing or storing data. Select the Tag colors tab. Click Add tag color enter a tag of “data”. Whenever a backlog item or bug is tagged with data, that tag will be highlighted.
-
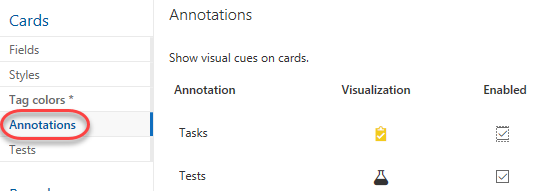
You can also specify which Annotations you would like included on cards to make them easier to read and navigate. When an annotation is enabled, the child work items of that type are easily accessible by clicking the visualization on each card.
-
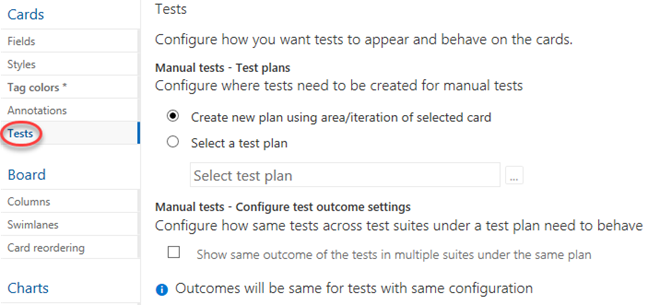
The Tests tab enables you to configure how tests appear and behave on the cards.
-
Click Save.
-
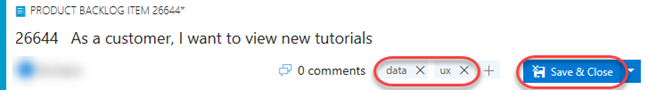
Open the new tutorials backlog item.
-
Add tags for “data” and “ux”. Click Save & Close.
-
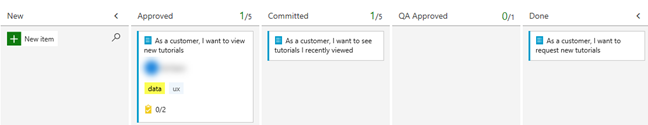
Note that the two tags are now visible on the card, although the data tag is highlighted yellow as configured.
-
Click the Configure team settings button.
-
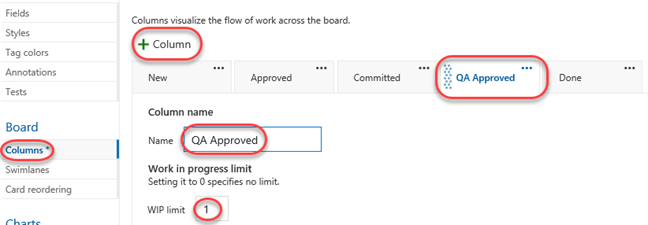
Select the Columns tab. This section allows you to add new stages to the workflow. Click Add Column and set the Name to “QA Approved”. Set the WIP limit to “1”, which indicates that only one work item should be in this stage at a time. You would ordinarily set this higher, but there are only two work items to demonstrate the feature with here. Move the stage to occur between Committed and Done.
-
Click Save.

-
You will now see the new stage in the workflow.
-
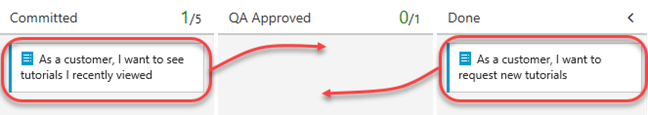
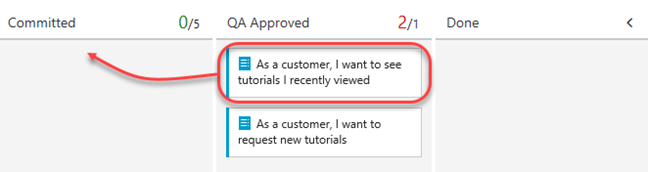
Move the work items from Committed and Done into QA Approved.
-
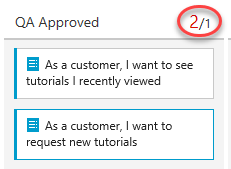
The stage now exceeds its WIP limit and is colored red as a warning.
-
Move the recently viewed backlog item back to Committed.
-
Click the Configure team settings button.

-
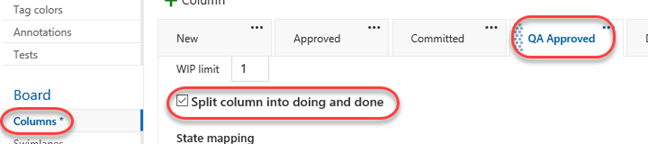
Return to the Columns tab and select QA Approved. A lag often exists between when work gets moved into a column and when work starts. To counter that lag and reveal the actual state of work in progress, you can turn on split columns. When split, each column contains two sub-columns: Doing and Done. Split columns let your team implement a pull model. Without split columns, teams push work forward, to signal that they’ve completed their stage of work. However, pushing it to the next stage doesn’t necessarily mean that a team member immediately starts work on that item. Check Split column into doing and done to create two separate columns for this.
-
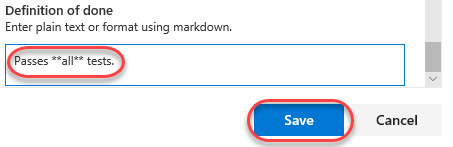
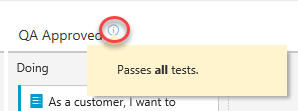
As your team updates the status of work as it progresses from one stage to the next, it helps that they agree on what done means. By specifying the Definition of done criteria for each Kanban column, you help share the essential tasks to complete before moving an item into a downstream stage. Add a Definition of done using markdown, such as “Passes **all tests.”. Click **Save.
-
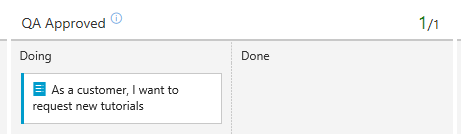
Note that the QA Approved stage now has Doing and Done columns.
-
You can also click the icon next to the column header to read the Definition of done.
-
Click the Configure team settings button.

-
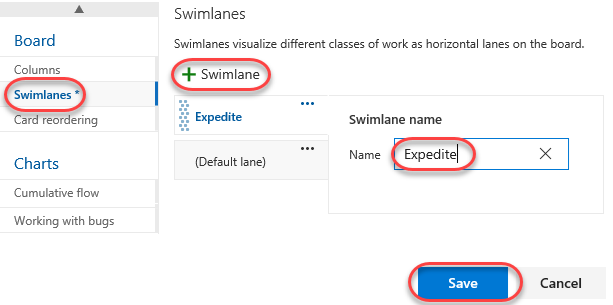
Your Kanban board supports your ability to visualize the flow of work as it moves from new to done. When you add swimlanes, you can also visualize the status of work that supports different service-level classes. You can create a swimlane to represent any other dimension that supports your tracking needs. From the Swimlanes tab, click Add Swimlane and set the Name to “Expedite”. Click Save.
-
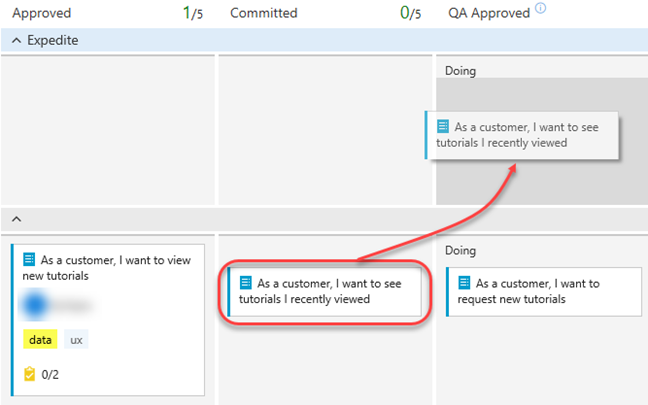
Drag and drop the Committed work item onto QA Approved | Doing so that it gets recognized as having priority when QA bandwidth becomes available.
-
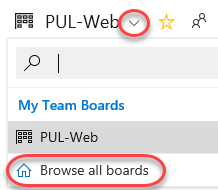
If you would like to review a more sophisticated board with many more work items, select Browse all boards from the team dropdown.
-
Select the Parts Unlimited Team boards.
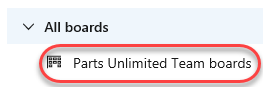
-
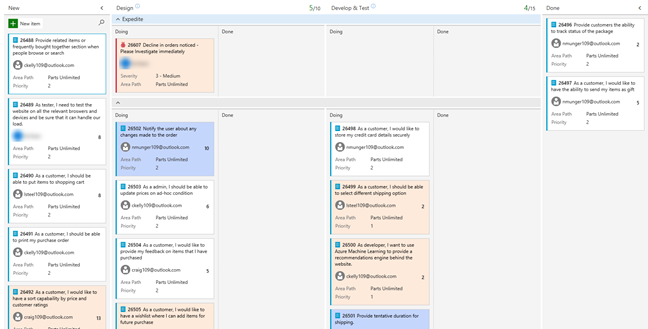
This board provides a playground for you to experiment with and review the results.
Task 5: Defining dashboards
-
Navigate to Overview | Dashboards.

-
Dashboards allow teams to visualize status and monitor progress across the project. At a glance, you can make informed decisions without having to drill down into other parts of your team project site. The Overview page provides access to a default team dashboard which you can customize by adding, removing, or rearranging the tiles. Each tile corresponds to a widget that provides access to one or more features or functions.
-
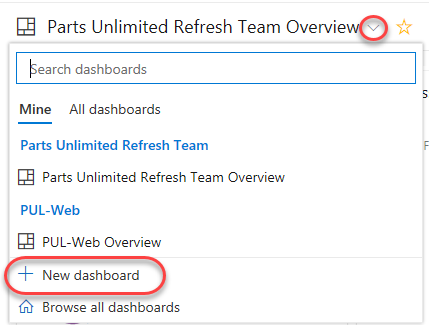
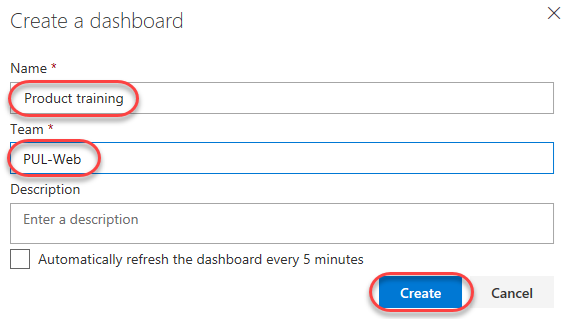
From the dashboard dropdown, select New dashboard.
-
Set the Name to “Product training” and select the PUL-Web team. Click Create.
-
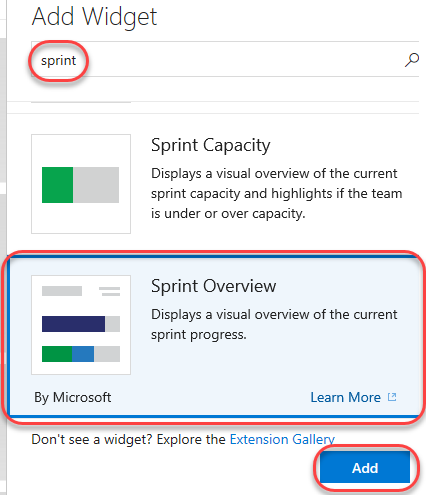
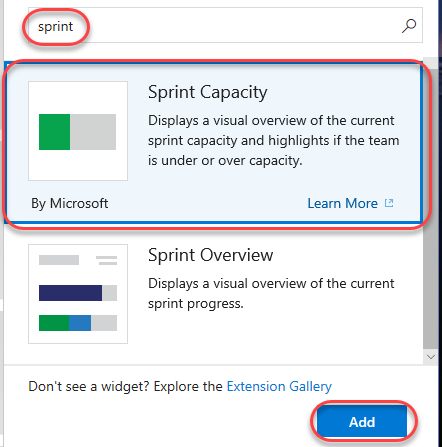
In the Add Widget panel, search for “sprint” to find existing widgets that focus on sprints. Select Sprint Overview and click Add.
-
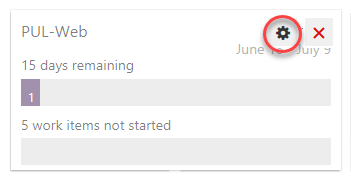
Many widgets have options you can configure. Click the Settings button.
-
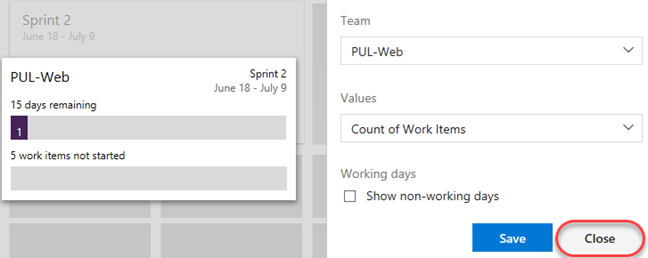
The quantity and depth of settings will vary by widget. Click Close to dismiss.
-
Search the widgets again for “sprint” and add the Sprint Capacity widget.
-
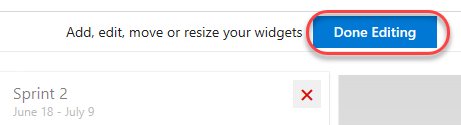
Click Done Editing.
-
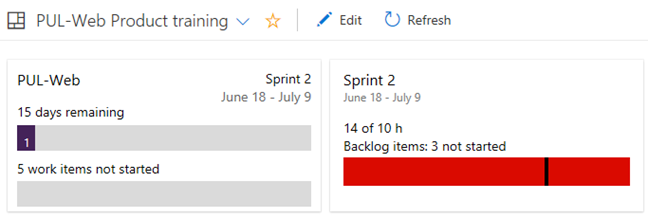
You can now review two important aspects of your current sprint on your custom dashboard.
-
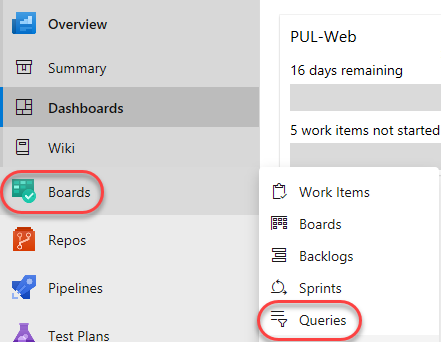
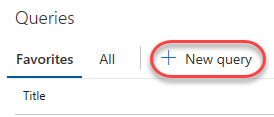
Another way of customizing dashboards is to generate charts based on work item queries, which you can share to a dashboard. Navigate to Boards | Queries.
-
Click New query.
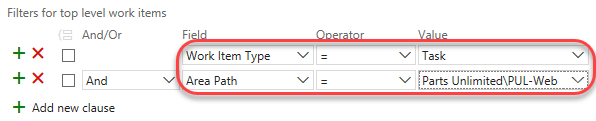
-
Set the first term to Work Item Type = Task and the second term to Area Path = Parts Unlimited\PUL-Web.
-
Click Save query.
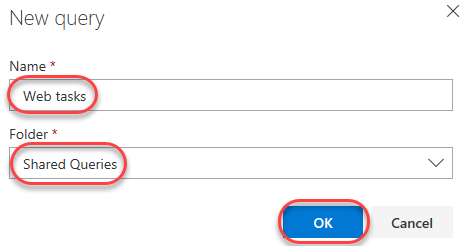
-
Set the Name to “Web tasks” and the Folder to Shared Queries. Click OK.
-
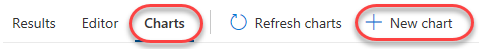
Select the Charts tab and click New chart.
-
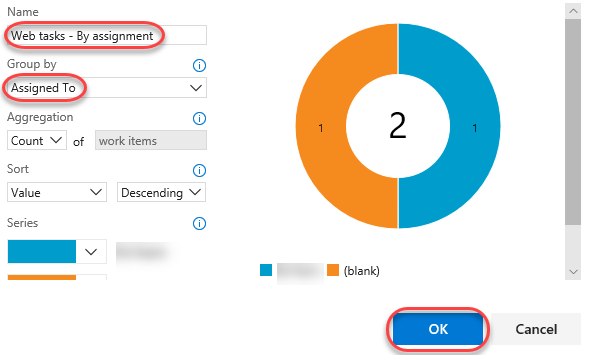
Set the Name of the chart to “Web tasks - By assignment” and Group by to Assigned To. Click OK to save.
-
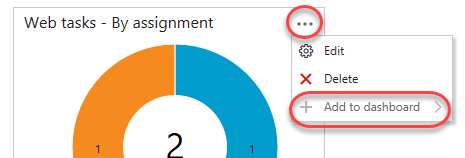
You can now add this chart to a dashboard.
-
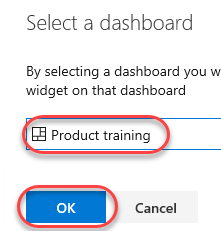
Select the Product training dashboard and click OK.
-
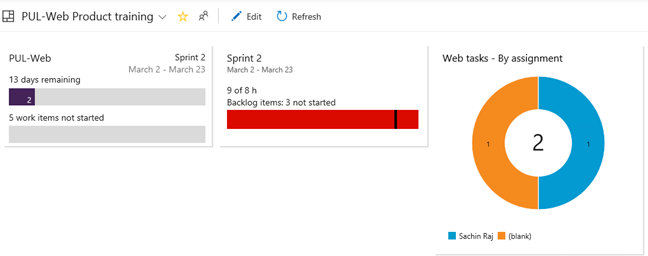
Navigate to Overview | Dashboards.
-
Your chart is now visible on the product training dashboard.